Understanding the Benefits of Waterfall Charts

In the world of business intelligence and data visualization, a myriad of chart types have been developed to help articulate complex metrics. Bar graphs, pie charts, and scatterplots are just a few of the numerous means of graphical representation. However, when it comes to representing incremental change over time or across categories, nothing can beat a simple yet profound waterfall chart. In this article, we will delve into the significance of waterfall charts, their unique structural features, and the irreplaceable benefits they offer to businesses.
Cracking the Code of Waterfall Charts
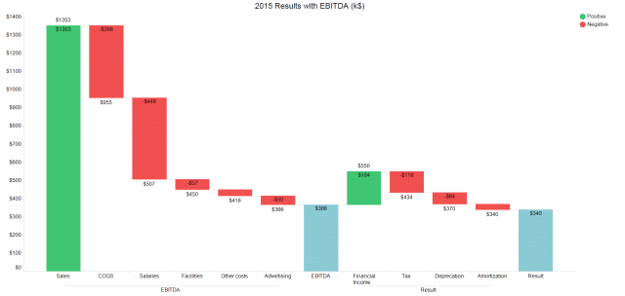
A waterfall chart, also known as a Mario chart, is a type of data visualization that illustrates how an initial value is affected by subsequent positive and negative values. The chart’s distinctive feature is that different sections of bars are colored to distinguish between positive and negative values, providing a clear visual demonstration of how values increase and decrease.
Waterfall charts can be useful in various fields for various purposes. In finance and accounting, they are commonly used to explain the incremental transitions in a financial metric over time. They can show how starting equity is impacted by a series of gains and losses over a period. Moreover, when used in sales and marketing, they can elegantly visualize the cumulative effect of sequentially introduced positive or negative values.
The Advantages of Using Waterfall Charts
While simple graphs can certainly paint a vivid picture, they often lack the detail necessary for comprehensive insights. This is one area where the waterfall chart holds an edge. By providing a granular view of how different elements contribute to a final aggregate value, waterfall charts enable decision-makers to see beyond top-level trends and surface the specifics that drive those trends.
Another compelling advantage of the waterfall chart is its usability in representing complex data. It can effectively break down and visualize a complicated subset of data, particularly when one wants to represent fluctuating measures over time or across categories. This capability helps businesses to understand the sequences that lead to an end value, promoting effective decision-making and facilitating strategic planning.
Furthermore, the visual storytelling capability of waterfall charts gratifies the viewer’s inclination toward narrative comprehension. By illustrating the progression from one state to the next, waterfall charts translate complex data into a story, making it easier for the audience to process the information, remember it, and possibly even engage with it on an emotional level.
Business Uses for Waterfall Charts

Waterfall charts have become an essential tool in the business world, providing a visual representation of how various factors contribute to the overall change in a particular measure. These charts are incredibly versatile and can be used for a wide range of purposes, making them a valuable asset for data-driven business decisions.
One of the primary uses of waterfall charts is in financial reporting. They allow businesses to analyze and present their financial performance in a clear and concise manner. By showing the starting point, the positive and negative contributions, and the final result, these charts enable financial analysts to identify key factors affecting profitability, revenue growth, or cost control.
Another prominent application of waterfall charts is in project management. They provide a comprehensive overview of the different stages and milestones of a project, highlighting the exact impact of each element on the overall outcome. This helps project managers and their teams to track progress, identify potential bottlenecks, and make informed decisions to keep the project on track.
Additionally, waterfall charts are valuable in sales and marketing analysis. They can showcase the different factors influencing sales performance over a specific period, such as changes in market conditions, advertising campaigns, or pricing strategies. By visually representing the flow of these factors, businesses can understand the strengths and weaknesses of their sales process and make data-driven adjustments to optimize their revenue.
Business leaders, entrepreneurs, and data enthusiasts should strive to master the art of creating waterfall charts, as they provide a compelling means to translate complex business data into easy-to-digest visual stories. Whether your goal is to track financial performance, explain a cost structure, or understand the evolution of an index over time, a waterfall chart can provide a fresh perspective while illuminating the unexplored terrains of your data.